Closing
Seeing your trends and patterns
What surfaces after months of logging: whether a category is genuinely tight or you just had bad luck, and what to move to fix it.
- 1
First, the history
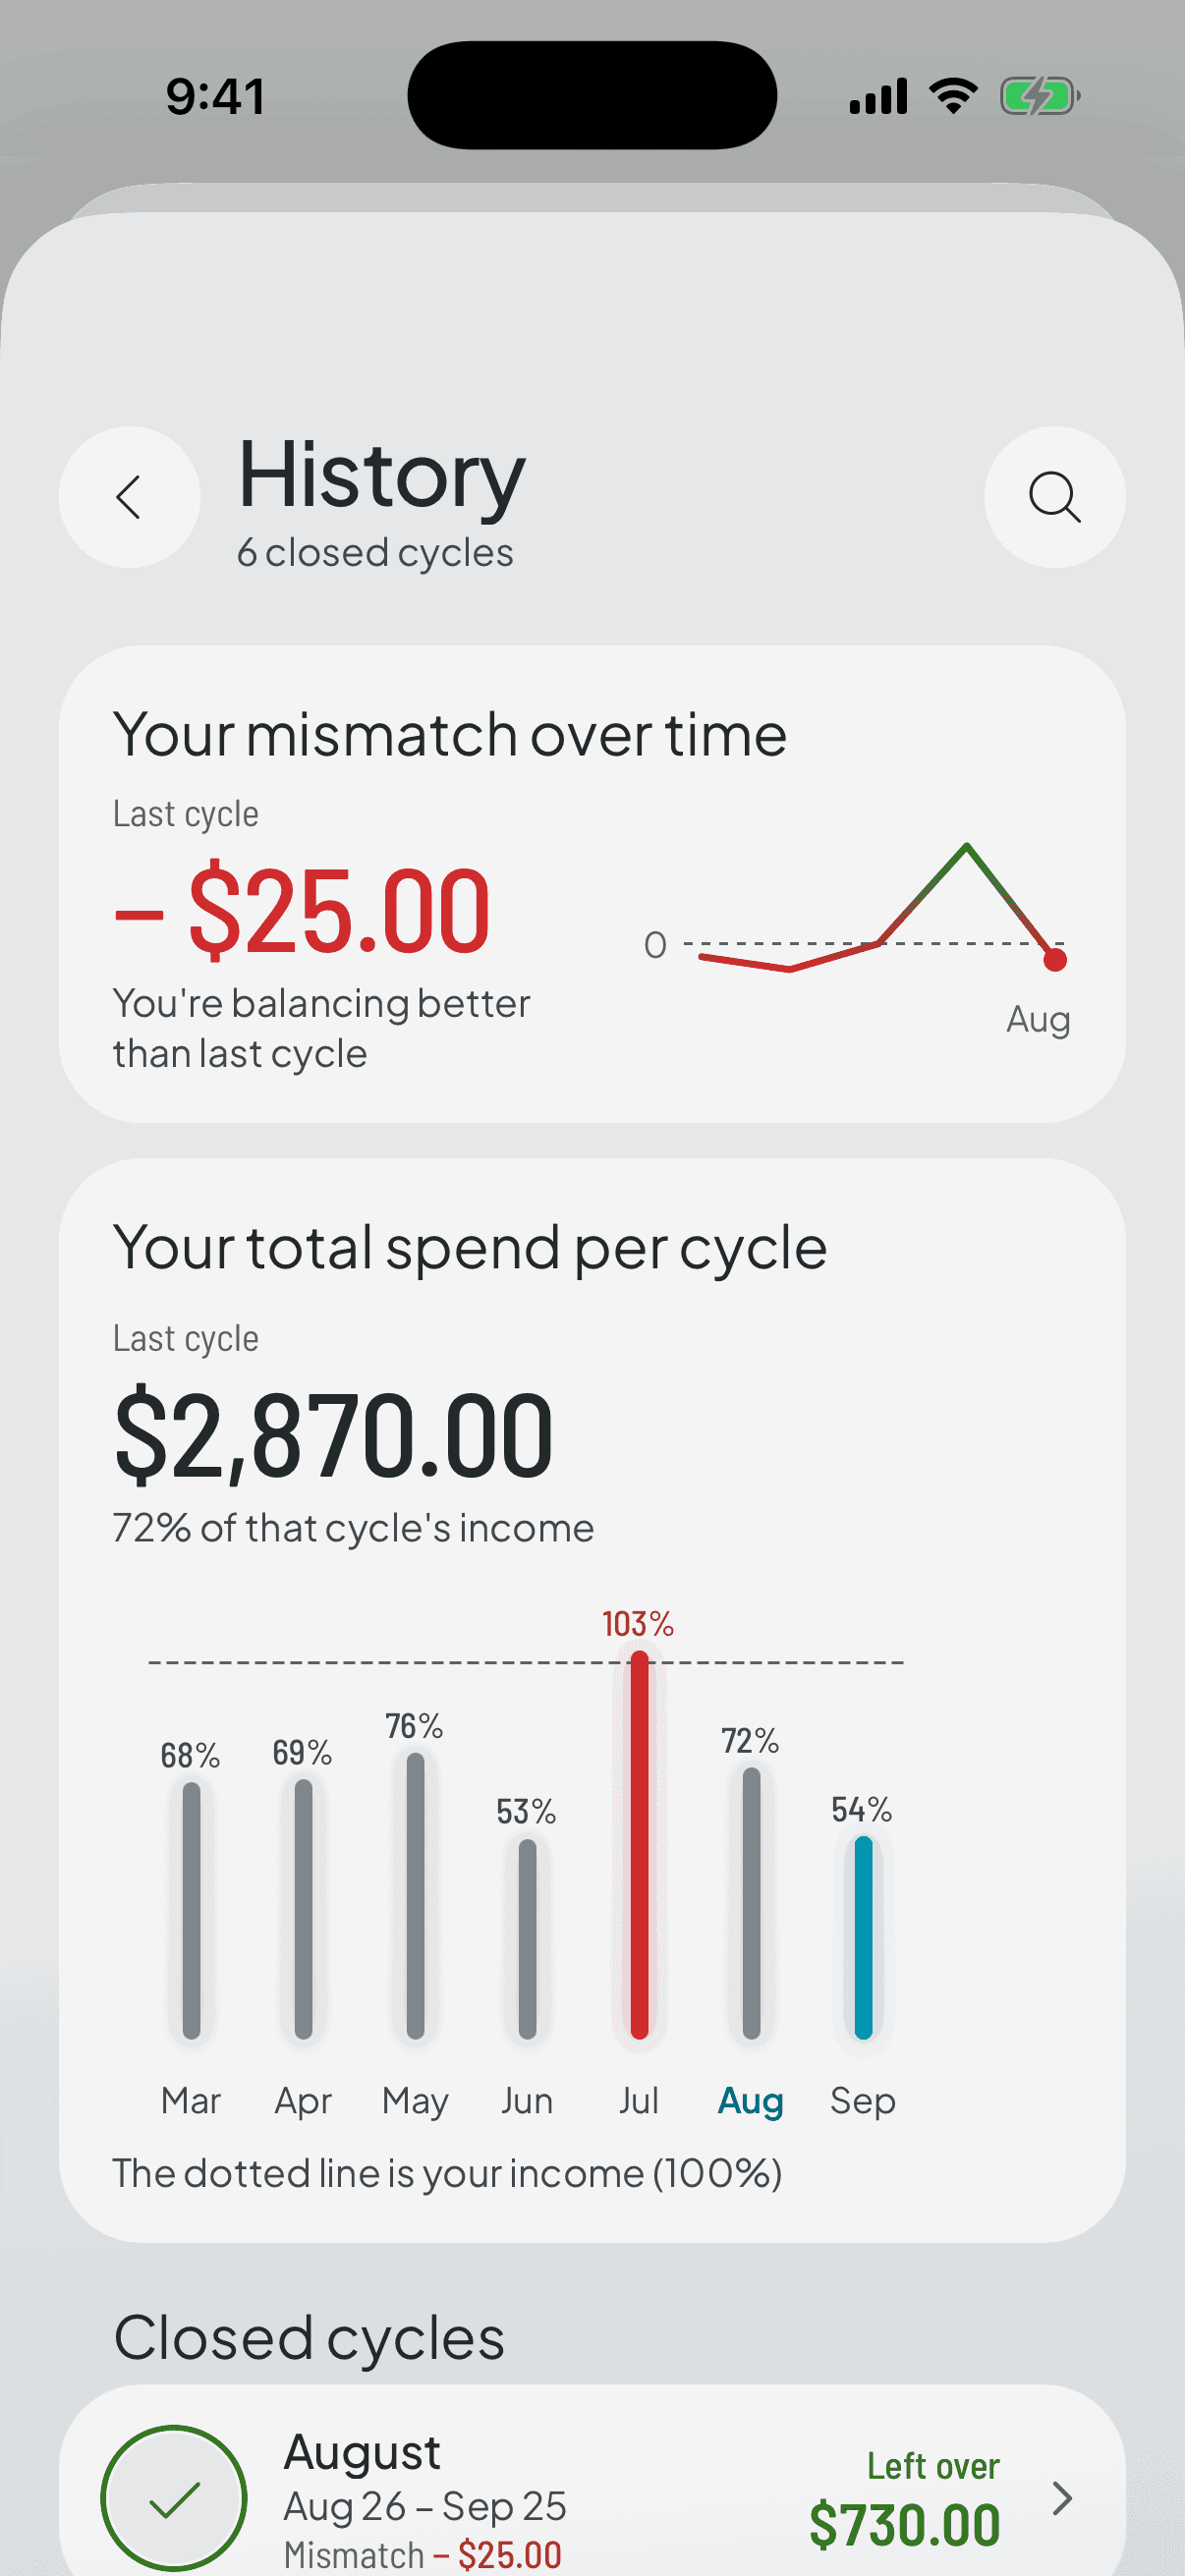
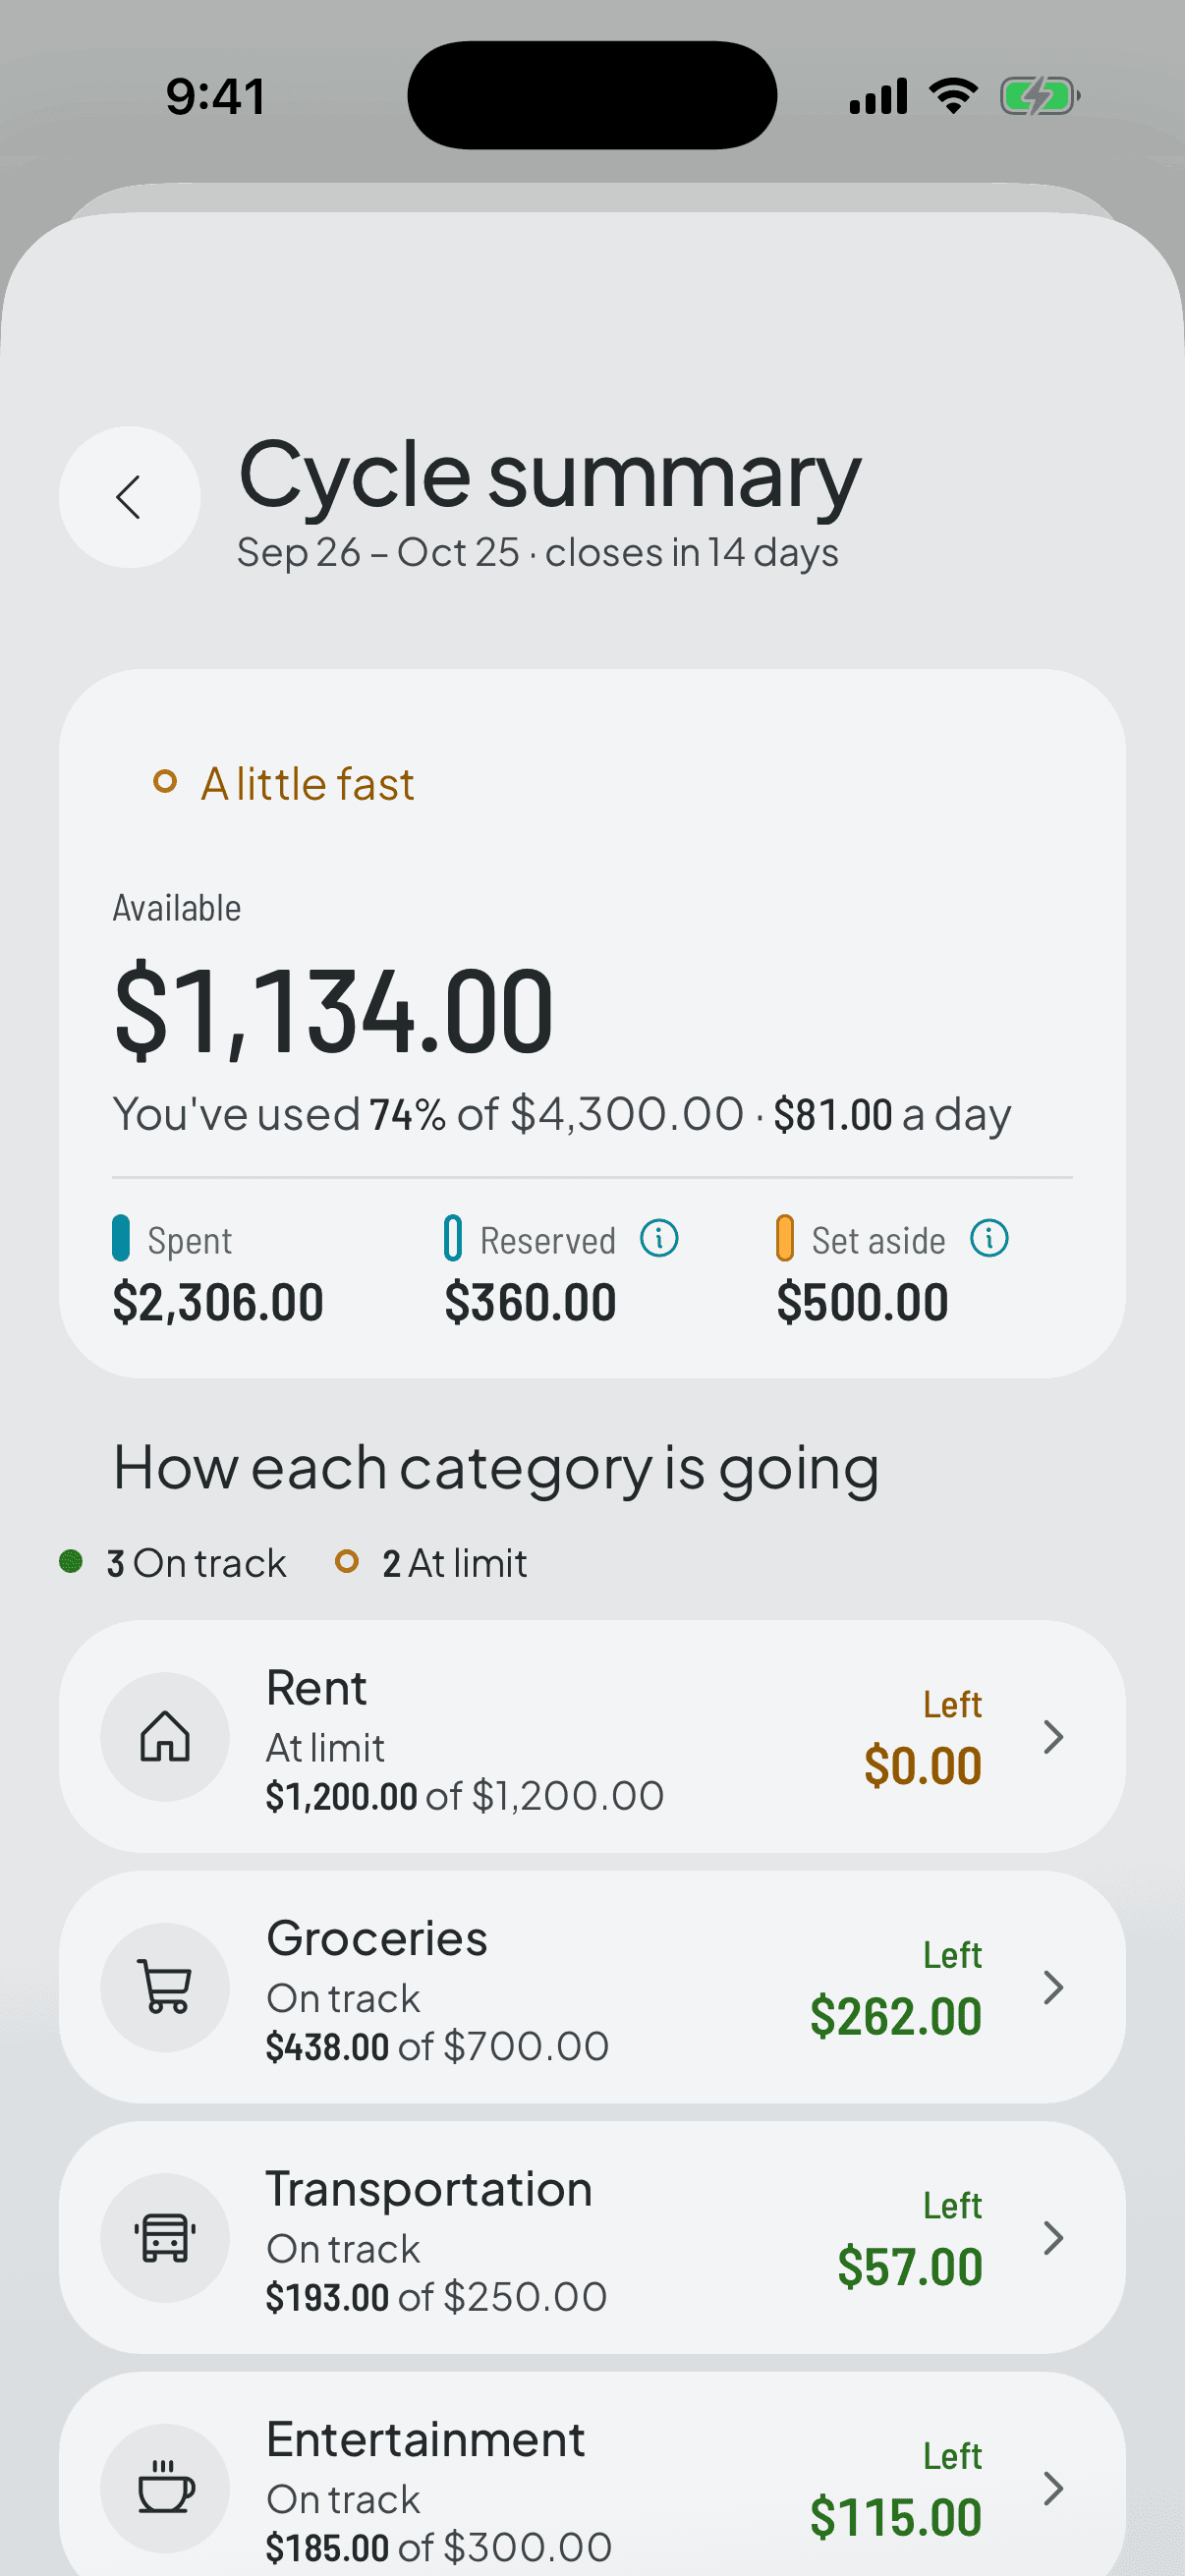
Every closed cycle is kept with its balance and its gap, and can be opened to see the full picture: the targets it had, what was spent per category, and each verdict.
The free plan keeps the three most recent closes. Premium opens the whole history.
- 2
Always against the target, never against another month
The charts compare what you spent with that cycle's target, not one cycle against another. Two cycles of different lengths or different income aren't comparable, and racing them just manufactures guilt aimed at the wrong thing.
From here on it's all Premium: the charts, the patterns and the proposal. What stays free is the history of your three most recent closes, each with its balance and its mismatch.
- 3
The patterns that surface on their own
With a few cycles behind you, the app flags three things: a tight category (three cycles running over), a loose one (three running under) and a gap that keeps growing.
These are rules, not fortune-telling: they're computed from your own numbers, and there's no artificial intelligence looking at your spending.
- 4
And one concrete suggestion
When there's a tight category and a loose one at the same time, the app offers to move an amount from the second to the first. The total budget doesn't change: it's just better distributed.
You decide. Accept and it applies from the active cycle onwards; decline and nothing changes.